
Optical Water Sensor: Choosing the Right Technology
May 22, 2026otofarm deregister
July 6, 2026
blog page
Optical Water Quality Sensor: Complete Guide to Multi-Parameter Water Quality Monitoring
- What Is an Optical Water Quality Sensor?
- How Optical Water Quality Sensors Work
- Optical Sensor Parameters — What Can You Measure?
- Optical Water Quality Sensor vs Electrode
- Key Advantages of Optical Water Quality Sensors
- Optical Water Quality Sensor Applications by Industry
- How to Choose the Right Optical Water Quality Sensor
- Googolwater Optical Water Quality Sensor Range
- Optical Water Quality Sensor FAQ
If your team spends hours each month fixing probe drift, you are not alone. In fact, an optical water quality sensor could change that. Old electrode sensors were built for spot-checks. They were not built for 24/7 use. But modern plants and farms need just that.
An optical water quality sensor uses light to measure water quality. Specifically, it works by absorption, scattering, fluorescence, or reflection. No electrodes. No chemical reagents. As a result, you get steady, multi-parameter data with very little upkeep. Compared to electrode types, optical units save on maintenance, hold calibration longer, and track more parameters from one probe.
Optical sensing has come a long way.Googolwater and others have shown that light-based tools handle harsh field conditions — fouling, heat swings, high solids — while cutting workload. In particular, we have deployed over 20,000 optical sensors across 20+ countries.
This guide covers the physics, the parameters, and the trade-offs. By the end, you will know if optics make sense for your site.
savings vs electrode
calibration gap
size by 2032
Key Takeaways
- Optical water quality sensors use four main methods — absorption, scattering, fluorescence, and reflection — to track 5–10 parameters from one probe
- Optical DO sensors drift less than 0.3 mg/L per year and only need calibration every 3–6 months, not weekly like electrode types
- Switching from electrode to optical sensors cuts routine maintenance costs by over 70% — no membranes, no electrolyte, far fewer recalibrations
- The global water quality sensor market topped USD 6 billion in 2025 and may reach USD 11.45 billion by 2032, with optical gaining share
- Self-cleaning systems (wipers, compressed air) now ship on 85% of commercial optical probes, tackling biofouling in long-term setups
What Is an Optical Water Quality Sensor?
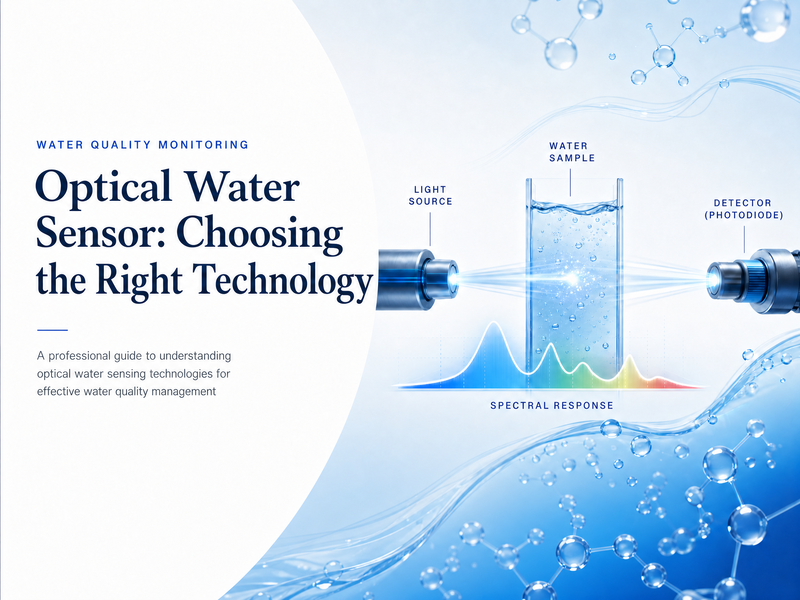
Notably, an optical water quality sensor measures water using light. It sends light through a water sample. Then it reads what comes back. No electrodes. Zero chemical reactions. And no reagents.
This is not new science. Labs have used spectrophotometers since the 1970s. What is new is that the hardware finally caught up. For instance, a 2024 review in Frontiers in Water shows that smaller UV LEDs and compact detectors drove the growth of optical sensors over the past 20 years. Today, absorbance-based sensors make up 72% of all commercial optical products surveyed in the 2024 review (Kumar & Khamis).
Absorbance-based optical sensors now hold 72% of the market. Cheaper UV LEDs and smaller detectors pushed this shift over two decades.
These sensors now live in the real world. They sit in aeration tanks. Some bolt to fish pond frames. Others ride out floods in rivers. They are replacing electrode types because they solve real problems — downtime, consumable costs, and data gaps from drift.
Moreover, the shift is speeding up. As UV LED and mini-spectrometer costs keep falling, researchers predict a new wave of lower-cost optical sensors in the next five years. That opens the door for smaller sites that could not afford them before.
How Optical Water Quality Sensors Work
Every optical water quality sensor uses at least one of four physical methods. Knowing these helps you pick the right sensor for your needs.
Optical Absorption: UV-Vis Spectroscopy
Absorption sensors measure how much light gets soaked up by substances in water. The rule is simple. More absorbing material means more light absorbed. In fact, this is the Beer-Lambert Law.
In practice, the sensor sends UV or visible light through a water sample. Then it reads the light that comes out the other side. Notably, organic matter absorbs strongly in the UV range, mainly at 254 nm. This makes the method ideal for chemical oxygen demand (COD) and total organic carbon (TOC) — two key metrics in wastewater and drinking water. Also, nitrate absorbs at 210–220 nm. So you can measure nitrate from the same light path.
Modern multi-wavelength sensors use two or more wavelengths (often 254 nm and 550 nm). This separates organic matter from turbidity noise. Furthermore, the Premium Resolution model goes further. It uses full fluorescence and absorption spectra to resolve overlapping signals that single-wavelength sensors miss.
Optical Scattering: Nephelometric Measurement
Scattering sensors measure how particles in water bend light. The most common setup is nephelometric measurement. Specifically, it detects light scattered at exactly 90 degrees to the source. This is the same method defined by ISO 7027 for turbidity.
When light hits water with suspended particles — silt, clay, algae, debris — those particles scatter light in all directions. The intensity of scattered light at 90 degrees links directly to particle count. Consequently, that is how optical sensors measure turbidity (in NTU) and estimate total suspended solids (TSS) without any chemicals.
For ultra-low turbidity in drinking water, specialized flow-through sensors route water through a measurement cell. The optimized shape gives detection limits below 0.1 NTU. As a result, this is far more sensitive than any electrode-based method.
Fluorescence Quenching: How Optical DO Sensors Work
Fluorescence sensors work differently. They measure how dissolved substances either emit light or suppress light from a dye.
Certainly, the biggest use case is dissolved oxygen (DO). Here, the sensor holds a dye that glows when lit by a blue or red LED. When oxygen touches the dye, it “quenches” the glow. More oxygen means less glow. This follows the Stern-Volmer equation.
Fluorescence DO sensors need no membrane, no electrolyte, and no warm-up. They respond in under 30 seconds. They drift less than 0.3 mg/L per year — a big win for teams used to weekly electrode care.
The result? A DO sensor with no membrane, no electrolyte, and no parts to replace. It turns on instantly. No warm-up needed. Furthermore, it responds in under 30 seconds (T90). It drifts less than 0.3 mg/L over a full year. For teams used to weekly membrane swaps and constant recalibration, this is a game-changer.
Optical Reflection and Transmission
The fourth optical method measures reflected or transmitted light. This is useful for color and UV transmittance (UVT).
Also, color sensors measure light absorption at multiple visible wavelengths. This reveals the true color of water — a key factor in drinking water treatment where looks matter. Notably, these sensors correct for turbidity. So you get accurate color readings even with some solids in the water.
UV transmittance at 254 nm (UVT254) is widely used as a proxy for organic matter. It is also a key input for sizing UV disinfection systems. A drop in UVT means rising organic load. Therefore, operators can adjust disinfection dose before problems occur.
Optical Sensor Parameters — What Can You Measure?
One big advantage of optical tech: one probe can measure many parameters. In contrast, an electrode sensor typically measures one parameter per device. Meanwhile, optical sensors routinely deliver 5–10 at once.
Core Water Quality Parameters
Organic Load Parameters
Nutrient and Biological Parameters
Why Multi-Parameter Optical Sensors Matter
Instead of running a rack of single-parameter sensors — each with its own cable, calibration, and failure mode — one multi-parameter optical probe can replace 4–6 devices. Fewer sensors. Next, fewer failure points. And fewer spare parts. Simpler setup. For a full overview of sensor types, see our water quality sensor selection guide.
Wondering what 10 parameters from one probe actually looks like? See the All-in-One optical sensor specifications →
Optical Water Quality Sensor vs Electrode — Direct Comparison
Choosing between optical and electrode sensors? Here is a head-to-head look based on current specs and published research. Click any column header to sort.
| Specification ▲ | Optical Sensors ▲ | Electrode Sensors ▲ |
|---|---|---|
| Measurement Method | Light interaction (absorption, scattering, fluorescence, reflection) | Chemical reaction at electrode surface |
| Parameters per Probe | 5–10 at once | 1 per device |
| DO Accuracy | ±0.1 mg/L | ±0.2–0.5 mg/L |
| DO Response Time (T90) | <30 seconds | 60–120 seconds |
| DO Drift Rate | <0.3 mg/L per year | 2–5% per month |
| Calibration Frequency | Every 3–6 months | Every 1–2 weeks |
| Warm-Up Time | Instant | 15–30 minutes |
| Consumables | None (cap every 1–2 years) | Membranes, electrolyte, filling solutions |
| Fouling Resistance | Flat window; auto-wiper compatible | Membrane prone to fouling; limited cleaning |
| Flow Dependence | Minimal | Moderate to high |
| Initial Unit Cost | $800–3,000+ | $200–800 |
| 3-Year Total Cost | Lower (few consumables) | Higher (recurring consumables + labor) |
| Best Suited For | Continuous monitoring, multi-parameter, remote | Short-term, spot-checks, budget-limited |
Total Cost of Ownership: Optical Sensor vs Electrode
Let’s do the math. For example, a mid-sized wastewater plant running 12 electrode DO sensors pays roughly $4,800–$7,200 per year for membranes, electrolyte, and consumables. That is before labor. With calibration visits every 1–2 weeks and membrane swaps every 2–4 weeks, labor adds $12,000–$18,000 per year. Total: $16,800–$25,200 just to keep 12 sensors running.
Now swap to optical units. Admittedly, upfront cost is higher — about $18,000–$36,000. But annual consumable costs drop to near zero (sensor caps at $200–400 every 1–2 years). Moreover, calibration drops from weekly to quarterly. Within 18 months, total cost flips in favor of optical. After that, savings compound every month.
A 12-sensor electrode setup costs $16,800–$25,200/year in consumables and labor. Switching to optical flips total cost within 18 months. Savings compound every year after.
That said, electrode sensors are not dead. For short-term projects, temporary setups, or sites where labor is cheap, electrodes still make sense. For a deeper look, see our electrode sensor technology guide. The key is matching the tech to the job.
Key Advantages of Optical Water Quality Sensors
To summarize, the table tells the cost story. But the real reasons teams switch have more to do with what happens at 2 AM when a sensor fails at a remote site.
Optical Sensors Cut Maintenance by 70%+
Specifically, this is what resonates most with operations teams. No membranes to tear. Zero electrolyte to spill. And no anode that dissolves over months. Optical sensors — especially fluorescence DO probes — need only a visual check and a cap swap every 1–2 years. For remote sites with limited staff, this alone justifies the cost.
Optical Sensor Stability: Months, Not Weeks
Think about the last time you trusted a sensor reading that was 8 weeks old. Indeed, optical sensors earn that trust.
Naturally, physics does not drift. Light absorption follows the same rules it did a century ago. Admittedly, the sensing element degrades — but slowly and predictably. That is why optical sensors hold calibration for months, not weeks.
Similarly, a review in Frontiers in Water (2024) confirmed that optical sensors are “less prone to sensor drift-related errors” than electrode options. Also, 63% of optical probes ship with factory calibration that stays valid for extended field use.
One Optical Probe, Multiple Parameters
As noted above, one optical probe can track COD, TOC, turbidity, TSS, nitrate, dissolved oxygen, chlorophyll-a, and color at the same time. This cuts setup cost, cabling, controller channels, and spare parts. For new builds or network expansions, the savings add up fast.
Optical Sensor Self-Cleaning Systems
Biofouling — algae, bacteria, and mineral scale on sensor surfaces — is the top enemy of any in-situ probe. The industry has responded. In fact, 85% of optical probes now have automated cleaning, per the Frontiers in Water survey. The most common is a mechanical wiper (47% of probes). Compressed air cleaning comes second (37%). Meanwhile, some models combine wipers with air or water bursts for tough fouling.
Reagentless Optical Measurement
Reagent-based analyzers create hazardous waste. They need regular restocking. And they cannot provide truly continuous data — each reading uses up reagent. Optical sensors skip all of that. They are fully reagentless. Consequently, this simplifies compliance, cuts costs, and enables true real-time data without supply chain worries.
Optical Sensor IoT and SCADA Integration
Also, modern optical sensors use standard protocols. RS485 Modbus RTU is the most common. That makes them plug-and-play with SCADA systems, PLCs, cloud platforms, and IoT gateways. IP68 housings handle full submersion. Ultimately, low maintenance plus easy connectivity makes optical the natural choice for remote monitoring networks.
Optical Water Quality Sensor Applications by Industry
Overall, optical sensors are not one-size-fits-all. Each industry has its own version of the same problem — and each needs a specific optical water quality sensor setup. Thus, here is what that looks like in practice.
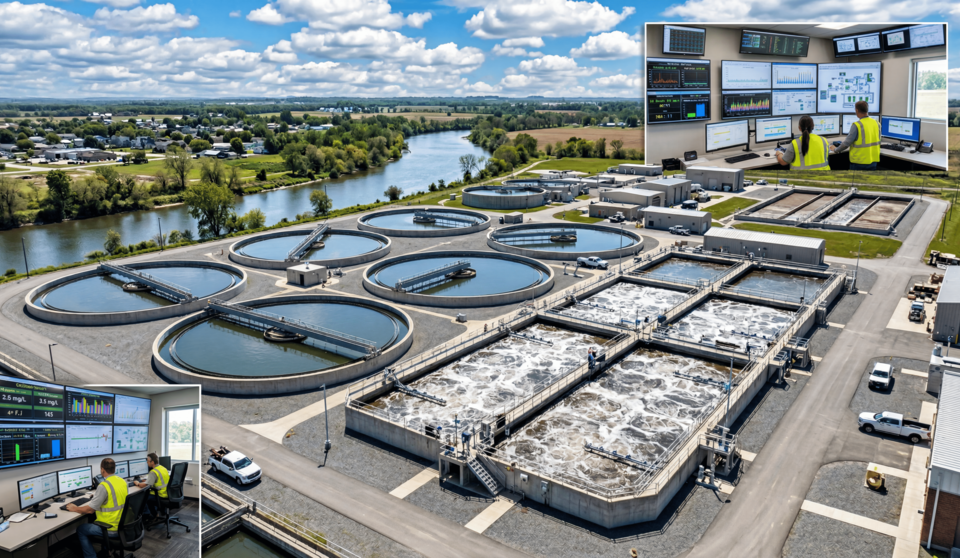
Wastewater: Optical Sensors for COD and DO Control
Specifically, wastewater plants are the biggest adopters of optical sensors. Namely, strict discharge rules and chronic maintenance headaches drive the switch.
The top uses are COD monitoring for organic load compliance and dissolved oxygen control in aeration basins. Aeration often eats 40–60% of a plant’s total energy. Optical DO sensors respond fast. As a result, that means tighter setpoint control — keeping DO just above the minimum without wasting energy on over-aeration. Energy savings alone often pay for the upgrade.
TSS monitoring at the clarifier outlet is another key use. Real-time TSS data spots clarifier upsets — sludge blanket rise, hydraulic shock, filamentous bulking — before permit violations happen. For more, see our wastewater treatment sensor guide.
At a 200,000 m³/day plant in Southeast Asia, the team replaced 16 electrode DO sensors with optical units. In the first year, they cut maintenance labor by 85%. They eliminated electrolyte purchases. And they improved aeration efficiency by 12% through more stable DO control. The engineer said the sensors paid for themselves in 14 months from saved consumables and labor.
Aquaculture: Optical DO Sensors Prevent Loss
Moreover, dissolved oxygen is the most critical parameter in intensive aquaculture. In fact, it is also the one most likely to cause catastrophic loss.
The thresholds are unforgiving. Below 3 mg/L, acute mortality risk starts. At 3.5 mg/L, feeding drops sharply. Between 4–5 mg/L, feed conversion worsens as fish burn energy on breathing instead of growth. Above 5 mg/L is the sweet spot. For salmonids, the bar is higher — they need above 6 mg/L.
Similarly, consider a 0.5-hectare shrimp pond with 12,000 kg of biomass. It risks losses over $60,000 if overnight hypoxia wipes out the crop. Optical DO sensors with alarms prevent this. They catch the nighttime DO drop hours before it turns critical.
In Vietnam, a shrimp farm installed optical DO sensors 10–20 cm above the pond bottom — the zone where hypoxia hits first. The sensors triggered aerators at 4.5 mg/L and hit emergency aeration at 3.0 mg/L. Over two grow-out cycles, survival improved 5% and aeration energy costs dropped 30%. Furthermore, the sensors also enabled oxygen-based feeding — pausing feed when DO fell below limits. That cut wasted feed and improved water quality.
Drinking Water: Optical Turbidity and Nitrate Monitoring
Drinking water plants use optical sensors for source water monitoring (turbidity, nitrate, TOC), process control (filter effluent turbidity, UVT for UV disinfection), and distribution system checks.
Similarly, picture this. March in the Midwest. Snowmelt flushes fertilizer into the river that feeds your plant. Suddenly, a nitrate spike at the intake triggers an alert. Your team switches to a backup source before the slug hits the process. That is what continuous optical nitrate monitoring does.
Meanwhile, turbidity sensors at filter outlets catch breakthrough in real time — a key compliance metric under EPA and EU rules. Color sensors with turbidity correction ensure finished water meets aesthetic standards without false alarms from harmless particles. For more on pollutants, see our guide to different pollutants in water.
Environmental: Optical Sensors for Algal Bloom Early Warning
Typically, environmental agencies deploy optical sensor networks for eutrophication monitoring and cyanobacteria early warning.
To illustrate, chlorophyll-a sensors detect rising algal biomass days or weeks before visible blooms form. Combined with nitrate and temperature data, they power predictive models for harmful algal bloom (HAB) events. As a result, authorities gain time to issue health advisories, adjust treatment, or take other action.
Multi-parameter optical buoys with DO, turbidity, chlorophyll-a, and temperature sensors provide continuous water quality profiles. Maintaining these with grab-sampling programs would be far too costly.
Industrial: Reagentless Optical Monitoring
In industry, meanwhile, optical sensors monitor cooling water (turbidity, biological growth), boiler feed water (TOC to guard against organic contamination), and process wastewater (COD compliance before discharge).
In particular, the reagentless design is a big plus in industrial settings. Chemical handling, storage, and disposal create regulatory and safety burdens. Subsequently, an IP68-rated optical probe with auto-cleaning can run continuously in tough process streams where an electrode sensor would need weekly care or replacement. For best practices, see our industrial water quality monitoring guide.
How to Choose the Right Optical Water Quality Sensor
At Googolwater, we ask five questions when helping teams pick a sensor. These apply whether you buy from us or anyone else.
Optical Sensor Parameter Selection
First, start with your parameter list. If you only need dissolved oxygen, a dedicated fluorescence DO sensor gives the best accuracy and value. Need COD, TOC, turbidity, and nitrate at once? That is common in wastewater and surface water. In that case, a multi-wavelength all-in-one sensor is cheaper than four single-parameter devices.
Also ask: do you need regulatory-grade accuracy, or is trend monitoring enough? For compliance-critical work, make sure the sensor’s specs meet your regulatory limits.
Optical Sensor Installation Environment
Certainly, depth, temperature, pressure, and chemical exposure all affect sensor choice. For high-temp or high-pressure use (like boiler feed water), check the rated operating conditions. For heavy fouling (raw wastewater, fish ponds), pick sensors with proven self-cleaning and tough anti-fouling design.
Second, install type matters too. Immersion sensors go right into tanks, basins, or open water. Flow-through sensors route a sample through a measurement cell. Typically, flow-through is preferred for ultra-low turbidity in drinking water, where controlled flow boosts accuracy.
Optical Sensor Maintenance Planning
Third, this is the question that often tips the scale. If you have techs who visit each sensor weekly, electrode sensors may work fine. However, if sensors are at remote sites visited monthly or less, optical sensors with self-cleaning and long calibration gaps are a must.
Finally, think about cleaning, too. Mechanical wipers work for most cases. Heavy biofouling may need compressed air or ultrasonic cleaning. Also factor in the cost and availability of replacement caps.
Optical Sensor Communication Protocols
Next, your sensor needs to talk to your control system. RS485 Modbus RTU is the industry standard for optical water sensors. It works with virtually every SCADA system, PLC, and IoT gateway. Some sensors also offer 4–20 mA analog outputs for older controllers. Make sure the communication options match your setup.
Optical Sensor Certification Requirements
Finally, for regulated industries, certifications are non-negotiable. Look for CE marking (check it was issued by an accredited body like TÜV). Additionally, check for RoHS compliance (ideally certified by SGS). And look for quality management certs (ISO 9001, ISO 14001, ISO 45001). These show the maker is committed to consistent quality.
Not sure which optical sensor matches your requirements? Download the Optical Water Sensor Selection Guide — a parameter-by-parameter comparison with application-specific recommendations.
Googolwater Optical Water Quality Sensor Range
Googolwater, a subsidiary of Googol Technology (stock code 301510), is headquartered in Chongqing, China, with offices in Hong Kong, China. Furthermore, over 20,000 optical water sensors have been deployed across 20+ countries. The range includes seven models for different monitoring scenarios:
| Model ▲ | Type ▲ | Key Parameters ▲ | Best Application ▲ |
|---|---|---|---|
| Basic All-in-One | Multi-Parameter | COD, TOC, Turbidity, TSS, Temp | Standard municipal plants |
| Advanced Resolution | Multi-Parameter | COD, TOC, Turbidity, TSS, Temp (higher precision) | Industrial & effluent compliance |
| Premium Resolution | Multi-Parameter | Full fluorescence + absorption spectra | Research-grade & complex multi-param |
| Ultra-Low Turbidity | Dedicated | Turbidity (<0.1 NTU) | Drinking water filtration |
| Dissolved Oxygen | Dedicated | DO (fluorescence quenching) | Aquaculture & aeration control |
| Turbidity | Dedicated | Turbidity (0–4000 NTU) | Wastewater & environmental |
| Water Color | Dedicated | Color (0–500 Pt-Co) | Drinking water & process |
All sensors carry CE certification (TÜV), RoHS compliance (SGS), and CQC quality/environment/occupational health certifications. Furthermore, every model features IP68 protection and RS485 Modbus RTU as standard.
Optical Water Quality Sensor FAQ
Sensor caps — the replaceable part with the luminescent dye or optical window — typically last 1 to 2 years in continuous field use. It depends on water quality and fouling. Heavy-fouling sites may need earlier replacement.
Yes. Optical sensors based on absorption, scattering, and fluorescence work regardless of salinity. Fluorescence DO sensors measure oxygen partial pressure, then convert to mg/L using built-in salinity, temperature, and pressure correction. Therefore, they work great for marine aquaculture and estuarine monitoring.
Admittedly, optical sensors cost more upfront. If your project runs 3 months with techs on-site daily, electrode sensors may be the smarter buy. However, for installations running 2+ years — especially at remote or unattended sites — total cost flips in favor of optical. The higher price buys years of lower labor and zero consumable costs.
Yes, optical sensors handle high-TSS water well. Turbidity sensors are built for this. However, at extreme levels (above 4000 NTU), you may need dilution sampling or high-range models. Self-cleaning (wipers, compressed air) is a must for accuracy in heavy-fouling applications like raw wastewater.
It depends on the parameter. Optical DO sensors typically need calibration every 3–6 months. UV absorption sensors (COD, TOC, nitrate) often ship with factory calibration and just need periodic field checks against lab samples. Meanwhile, turbidity sensors should be verified against formazin standards every 1–3 months. Always follow the maker’s guidelines.
Yes. RS485 Modbus RTU is the industry standard for optical water sensors. It works with virtually all modern SCADA systems, PLCs, and IoT gateways. Many sensors also offer 4–20 mA analog outputs for older control systems.
Conclusion: The Case for Optical Water Quality Sensors
In summary, the technology works. Indeed, maintenance savings are real — 70% or more, across thousands of installations in 20+ countries. Clearly, the hard part is not justifying the switch to an optical water quality sensor. Rather, the hard part is picking the right setup for your water.
The global water quality sensor market is projected to nearly double — from USD 6.09 billion in 2025 to over USD 11 billion by 2032, per Research and Markets. Clearly, the industry is voting with its wallet. Optical tech is winning the largest share of new deployments.
Ultimately, whether you run a municipal plant, an aquaculture farm, or an environmental monitoring network, the right optical water quality sensor depends on your parameters, your site, and your budget.
Ready to explore optical sensing?
Browse Googolwater’s Full Sensor RangeContact the technical team for a free consultation — responses within 24 hours
