

Industrial Water Quality Monitoring Guide | 2026 Best Practices
May 9, 2026
Optical Water Quality Sensor: Complete Guide to Multi-Parameter Water Quality Monitoring
June 1, 2026
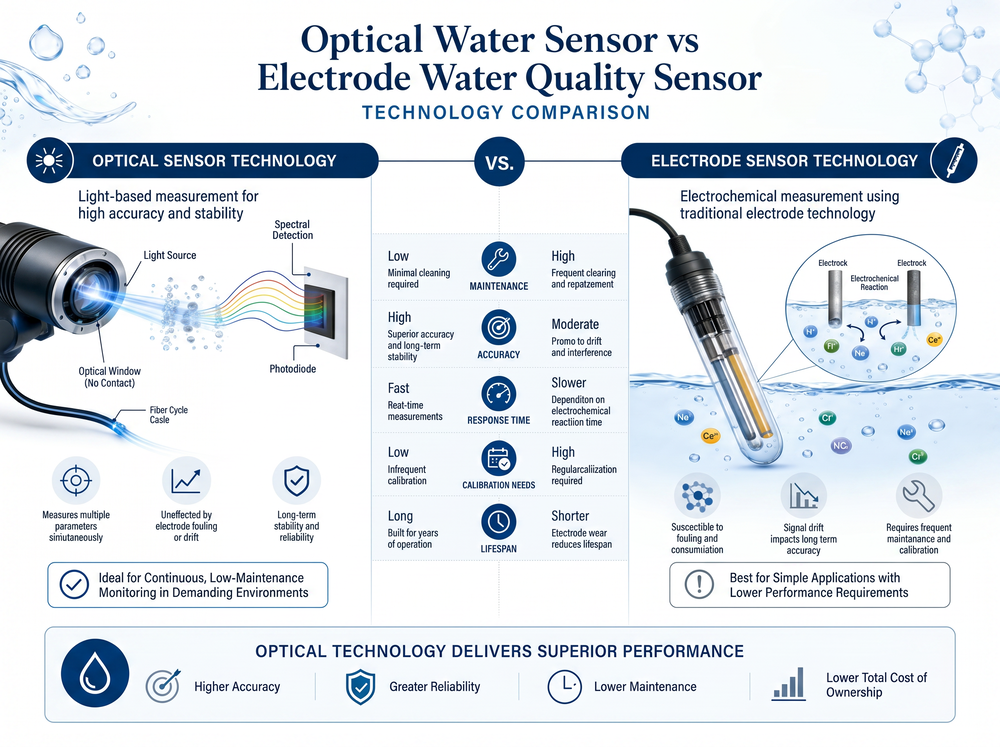
Optical Water Sensor vs Traditional Electrode Sensors: Complete Comparison
A comprehensive technical guide to help monitoring professionals choose the right optical water sensor or electrode technology — covering dissolved oxygen, turbidity, pH, conductivity, and beyond.
Choosing between an optical water sensor and a conventional electrode probe is one of the most consequential decisions in water quality monitoring. This guide compares both technologies head-to-head — covering measurement principles, maintenance workloads, accuracy trade-offs, and total cost of ownership — so you can make an informed choice without vendor spin.
We wrote this from an engineering perspective — drawing on field data from aquaculture farms, wastewater plants, drinking water networks, and industrial process streams. No marketing fluff. Just the technical details that determine whether a light-based measurement approach or an electrochemical one belongs in your monitoring station.
Key Takeaway: Optical technology typically costs 2–3× more upfront but delivers 60–70% lower total cost of ownership over 5 years due to near-zero maintenance. However, electrodes still dominate in specific niches like ultra-high-precision lab pH, sub-μS/cm conductivity, and ion-selective measurements. The best choice depends entirely on your application context.
1. How an Optical Water Sensor Works vs Electrode Technology
The Physics Behind an Optical Water Sensor
Optical water quality sensors measure water parameters by analyzing how light interacts with the sample. There are three primary optical methods used in commercial instruments:
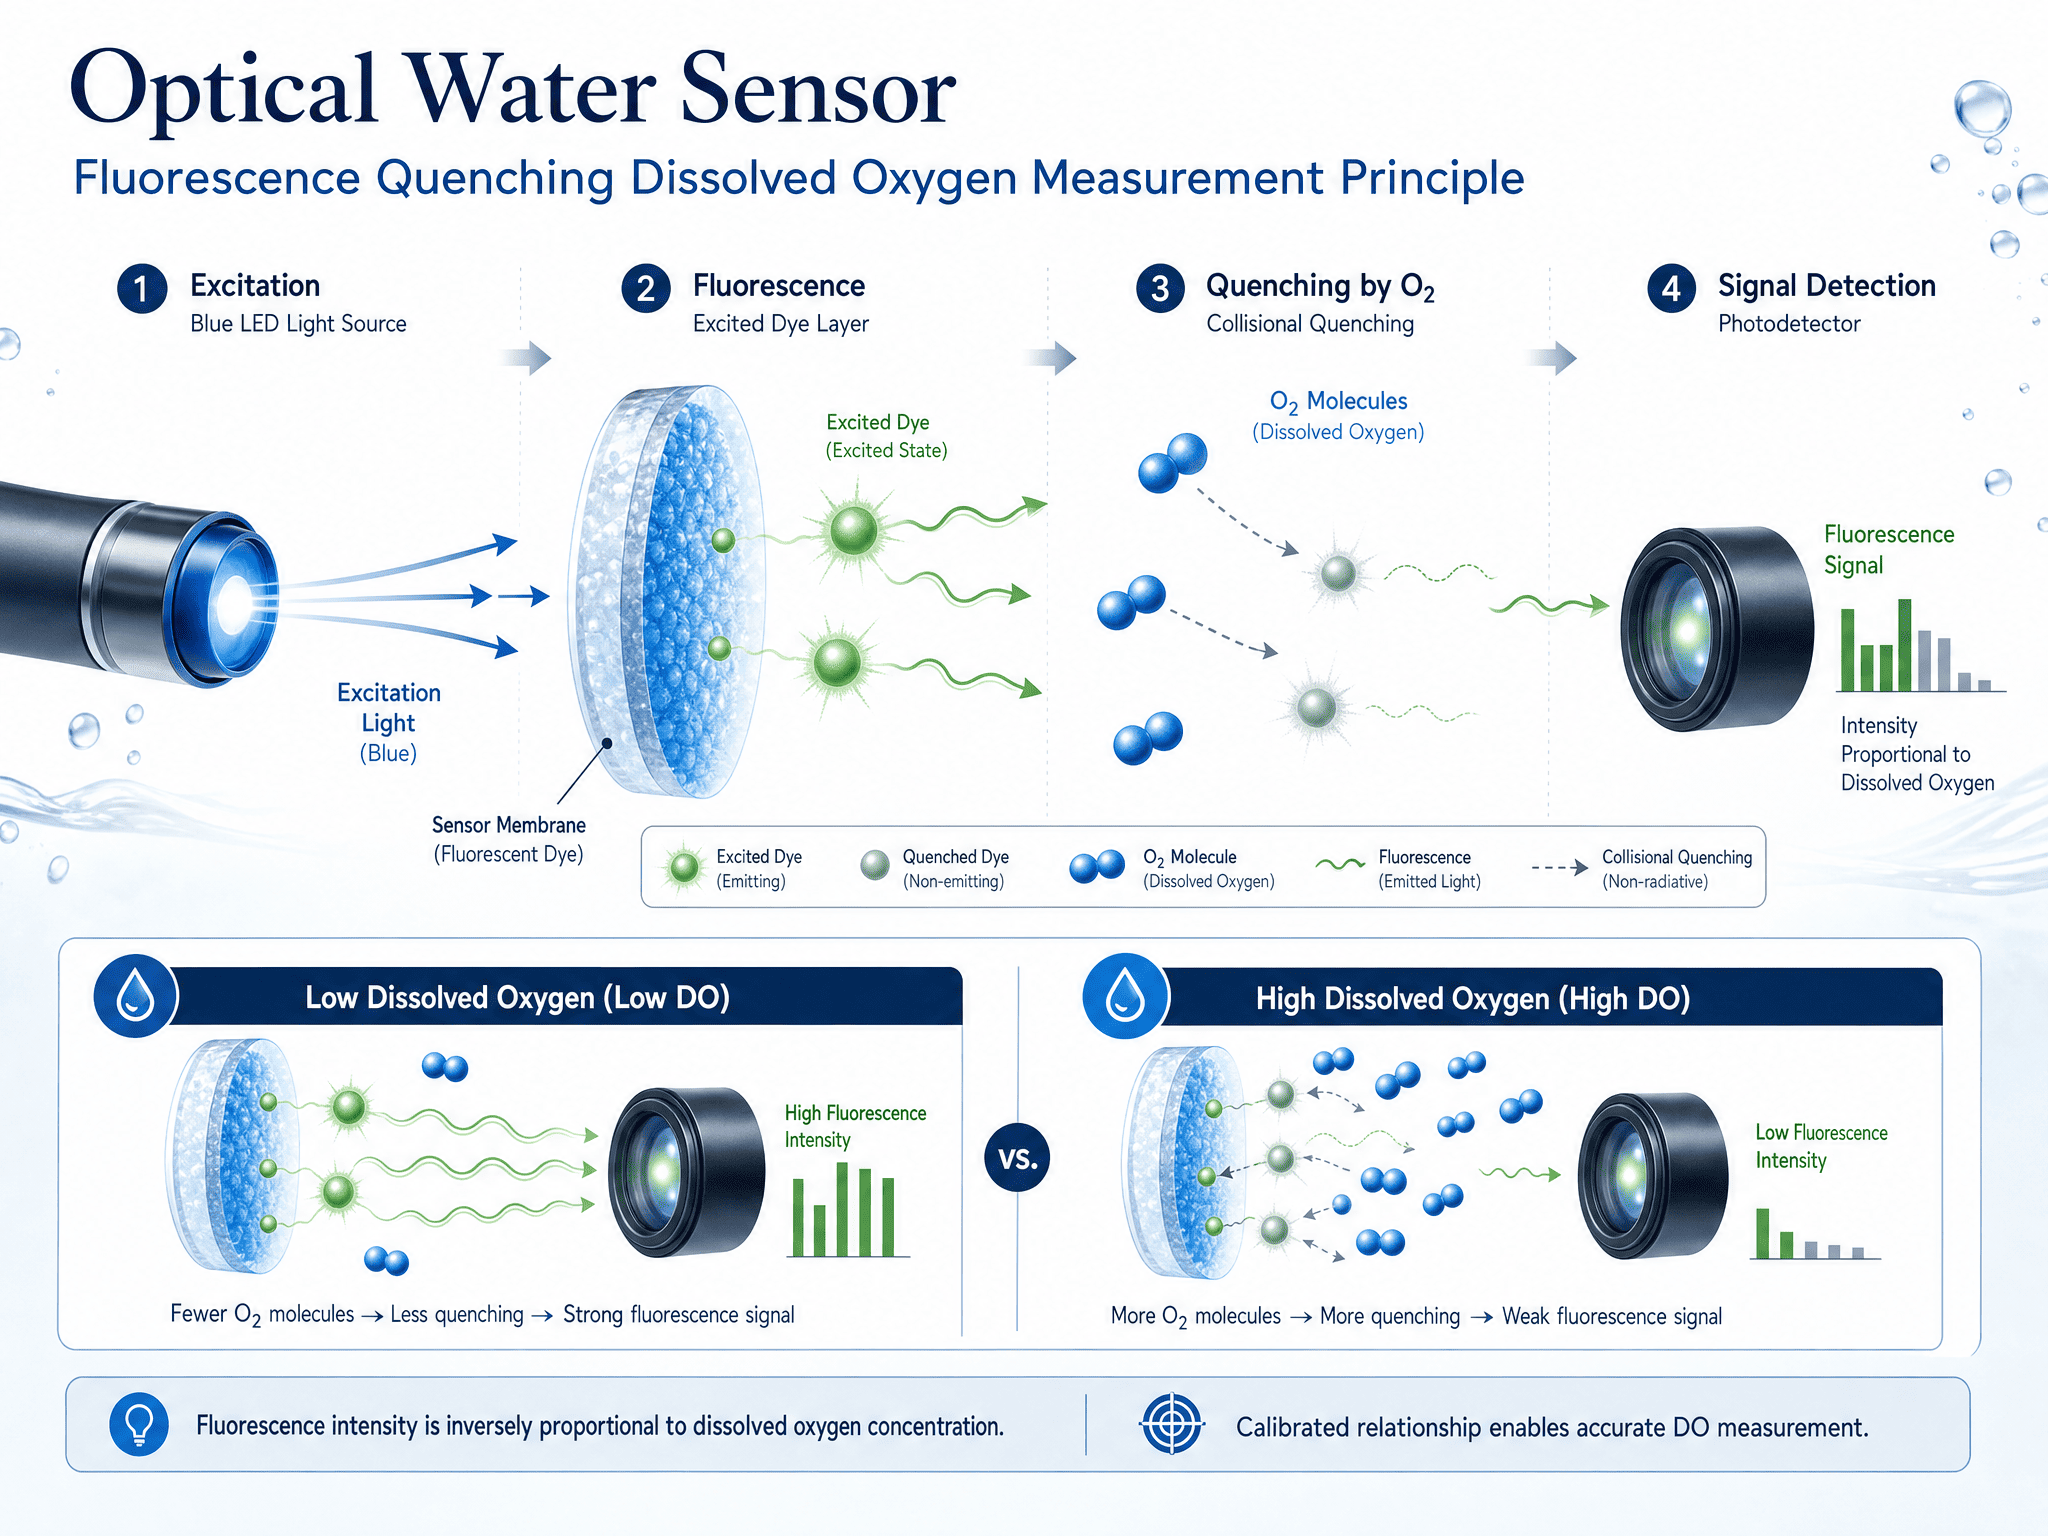
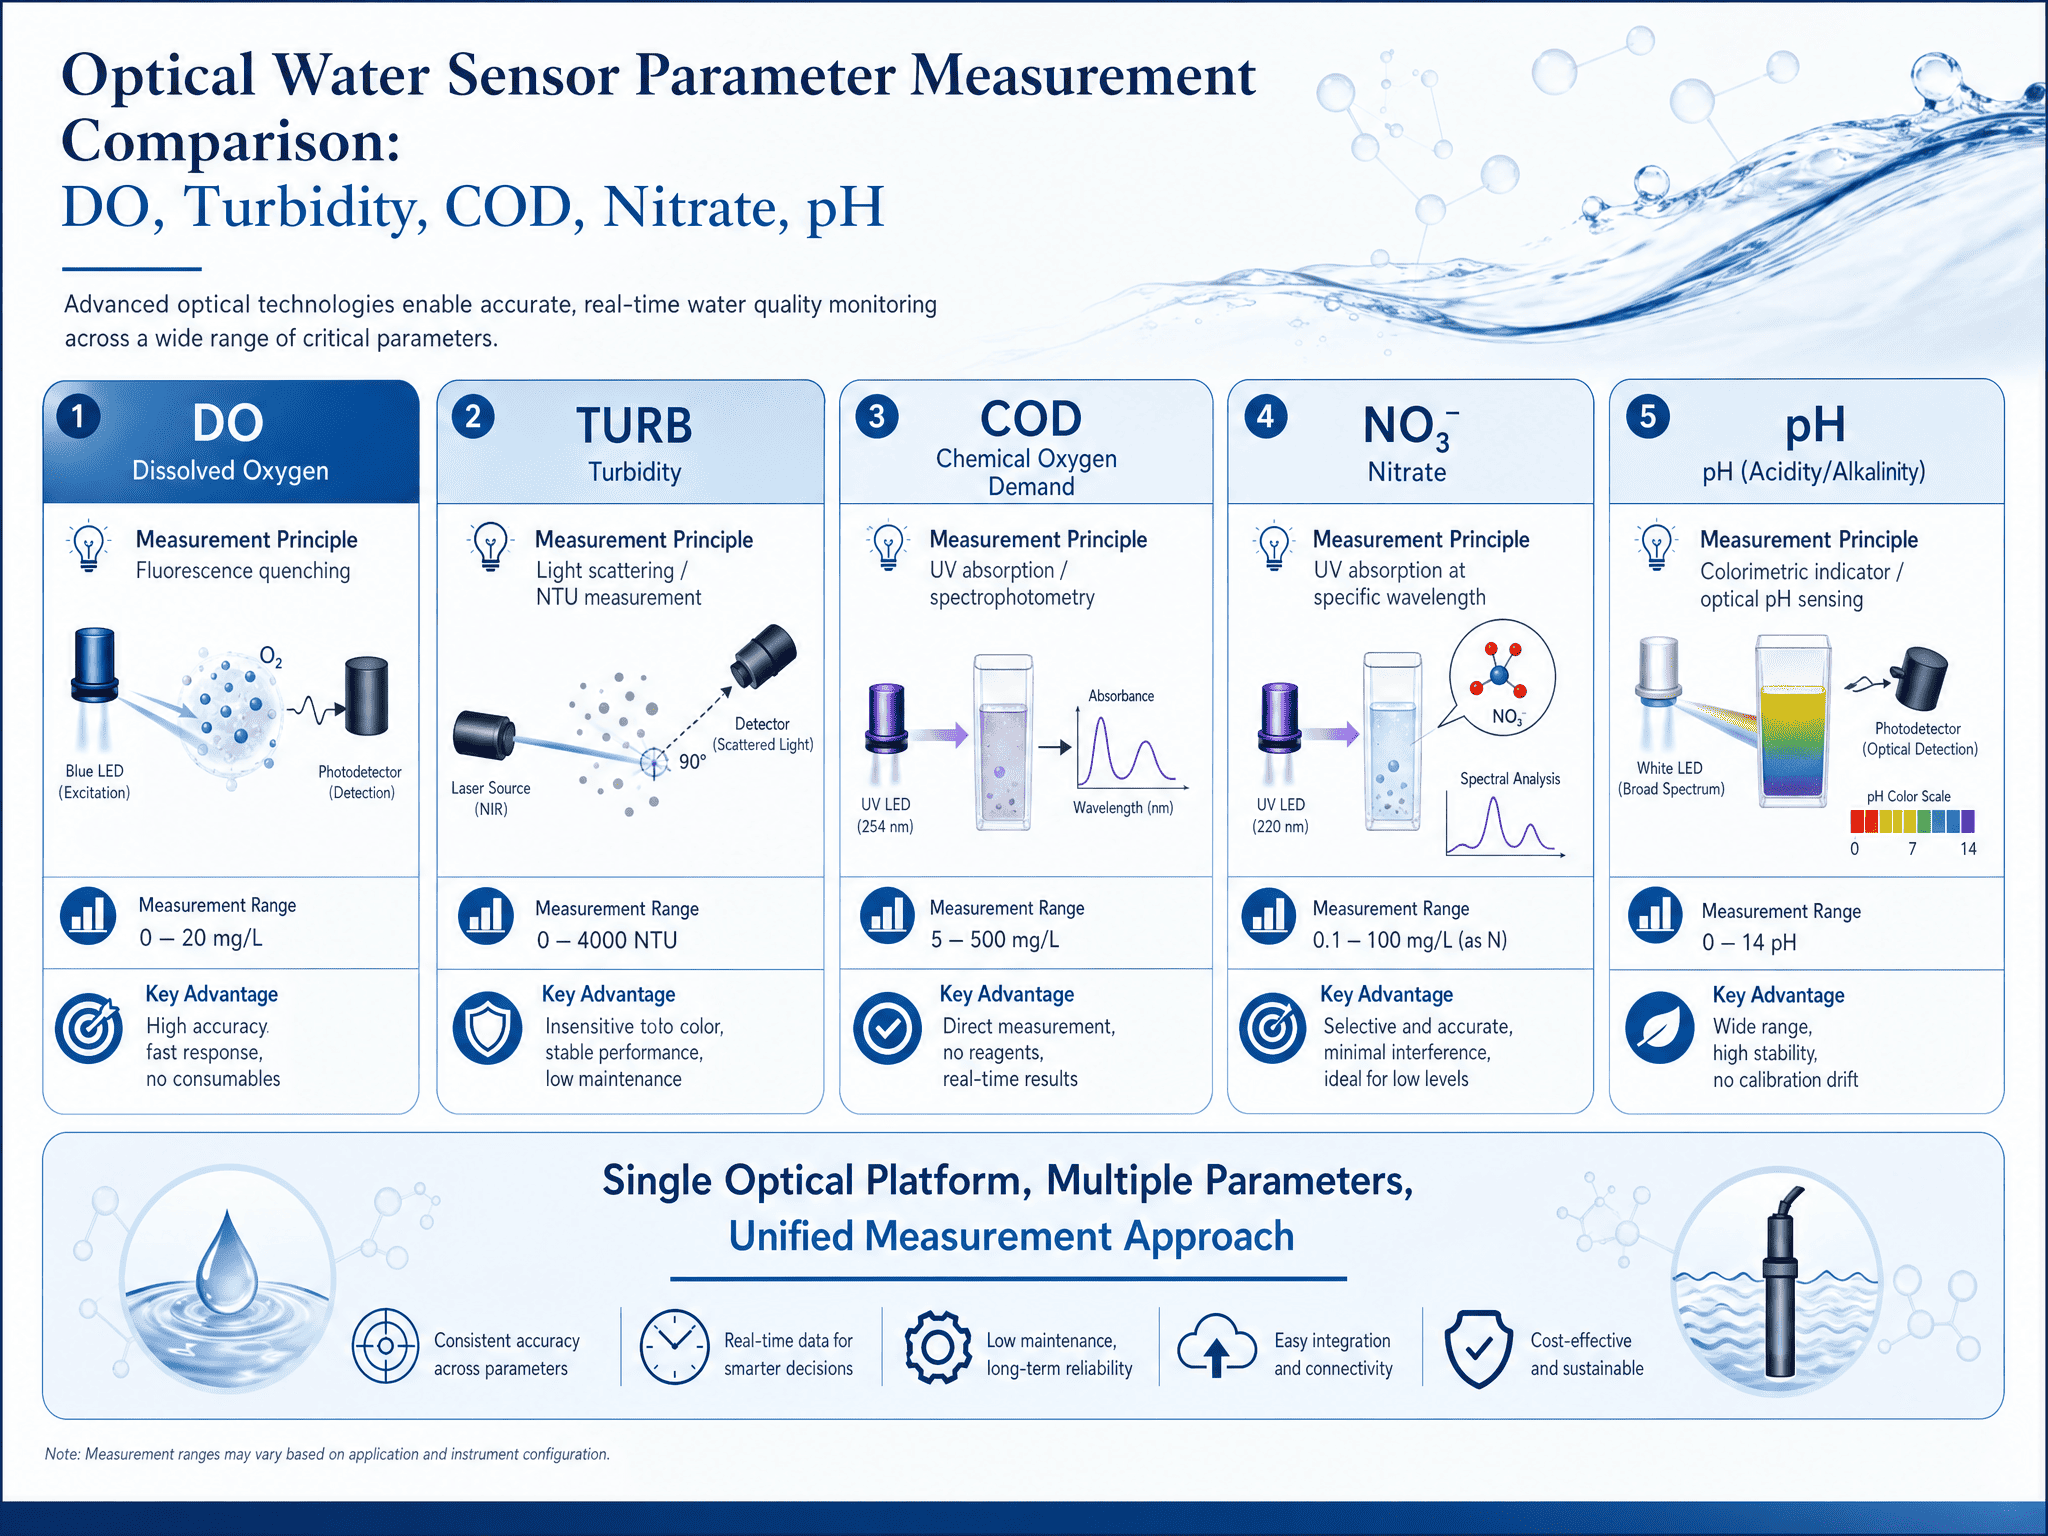
Fluorescence / Luminescence: A blue LED excites a luminophore coating on the sensor tip. When oxygen molecules collide with the excited luminophore, they quench the fluorescence intensity and shorten the decay time. By measuring the phase shift in the decay, the instrument calculates dissolved oxygen concentration without consuming any oxygen — fundamentally different from electrochemical approaches that deplete O₂ locally during measurement.
Nephelometric Scattering (Turbidity): An infrared LED emits light into the water at 90 degrees to a photodetector. Suspended particles scatter light toward the detector, and the scattered light intensity correlates directly to turbidity in NTU. Advanced optical instruments use multiple-angle detection (forward scatter, backscatter, 90°) to compensate for particle size variation and color interference.
UV Absorption (COD, Nitrate, BOD surrogate): A UV-LED lamp passes light (typically 200–380 nm) through a fixed-pathlength flow cell. Different organic compounds and ions have characteristic absorbance spectra. By measuring absorbance at specific wavelengths (254 nm for COD/SAC254, 220 nm for nitrate), the optical instrument computes concentrations without reagents. According to ISO 7027 (Water Quality — Determination of Turbidity), nephelometric sensors operating at 860 nm are the international standard for turbidity measurement.
The Chemistry Behind Electrode Sensors
Traditional electrode sensors operate on electrochemical principles:
Galvanic / Polarographic (DO): Oxygen diffuses through a thin gas-permeable membrane (usually PTFE or HDPE) and is reduced at a cathode (gold or platinum). The resulting current is proportional to the partial pressure of oxygen. In both galvanic and polarographic designs, the membrane is a consumable that degrades over time — the primary reason engineers increasingly switch to optical technology for long-term DO deployments.
Potentiometric (pH, ORP): A glass membrane develops a potential difference proportional to hydrogen ion activity on either side (Nernst equation: E = E₀ + (RT/nF)·ln[aH⁺]). The reference electrode provides a stable baseline using an internal KCl electrolyte that must be replenished as it slowly leaches through a porous junction.
Conductometric (EC/TDS/Salinity): Two or four metal electrodes apply an alternating current and measure the solution's electrical resistance, which is inversely proportional to ion concentration. Four-electrode designs cancel out electrode fouling effects using separate current-carrying and voltage-sensing pairs.
2. Head-to-Head Specification Comparison
Here's how optical technology stacks up against traditional electrodes across the criteria that matter most for field deployment — fourteen performance dimensions that directly affect data quality and operational cost.
| Criterion | Optical Technology | Electrode Sensor | Winner |
|---|---|---|---|
| Measurement Principle | Light interaction (fluorescence, absorbance, scattering) | Electrochemical reaction (current/potential) | — |
| Initial Unit Cost | $800 – $2,500 | $200 – $900 | Electrode ✗ |
| Calibration Frequency | Every 6–12 months (some pre-calibrated for 2 years) | Every 1–4 weeks | Optical ✓ |
| Consumables Required | None (cap replacement every 1–2 years optional) | Membranes, electrolyte, filling solutions (ongoing) | Optical ✓ |
| Typical Lifespan | 3–5 years (sensor body); cap every 1–2 yrs | 1–2 years (probe); membrane every 2–8 weeks | Optical ✓ |
| Flow Dependence | None (optical DO is stir-independent) | Yes — requires minimum flow or stirring | Optical ✓ |
| Fouling Tolerance | Better — smooth surface, no membrane pores to clog | Moderate — membrane pores trap biofilm/bacteria | Optical ✓ |
| Response Time (t₉₀) | < 30 seconds (optical DO probe) | 30–120 seconds (varies by membrane thickness) | Optical ✓ |
| Drift Rate | < 1% per month | 2–5% per month (membrane degradation) | Optical ✓ |
| Oxygen Consumption | None (non-destructive) | Yes — consumes O₂ during measurement | Optical ✓ |
| Laboratory Accuracy | ±0.1–1 mg/L (DO); ±2% (turbidity); ±0.05 pH | ±0.01 mg/L (DO); N/A (turbidity); ±0.01 pH | Depends on param. |
| Temperature Range | -5°C to 60°C (most models) | 0°C to 50°C (typical glass electrode limit) | Optical ✓ |
| Pressure Limit | Up to 10 bar (submersible models) | Up to 6 bar (membrane deformation risk) | Optical ✓ |
| 5-Year TCO Estimate* | $2,000 – $3,500 | $5,500 – $8,500 | Optical ✓ |
*TCO includes purchase price, all consumables, calibration labor (@$50/hr), and expected replacements. See Section 5 for detailed breakdown. For regulatory guidance on continuous monitoring instrumentation, refer to US EPA Method 415.3 and ISO 7027 turbidity measurement standards, both of which recognize optical sensor technology as a valid measurement approach.
3. Performance Breakdown by Parameter
Not all parameters can be measured optically, and not all electrodes are created equal. Here's what you need to know about each major water quality parameter:
Luminescence-Based Optical Sensor: The dominant technology for modern DO monitoring. No membrane to replace, no electrolyte to refill, no oxygen consumed, flow-independent, fast response (<30s), excellent fouling tolerance. Ideal for wastewater, aquaculture, and environmental monitoring.
Electrode (Galvanic/Polarographic): Still used in benchtop lab equipment where initial cost dominates and frequent maintenance is acceptable. Membrane fouling is the primary failure mode in biological waters. Requires weekly calibration in demanding applications.
Verdict: Choose an optical water sensor for any field or continuous monitoring application. Reserve electrodes for occasional spot-check laboratory use.
Nephelometric Sensor: The only viable technology for turbidity and Total Suspended Solids (TSS) measurement. ISO 7027-compliant optical instruments use 860 nm IR LEDs to eliminate color interference. Multi-angle detection improves correlation to gravimetric TSS across varying particle size distributions.
Electrode: Cannot measure turbidity. No traditional electrode technology exists for this parameter.
Verdict: Optical nephelometry is your only practical option. Invest in a dual-detector (scattered + transmitted) model for best accuracy in variable-color water.
Glass Electrode: The gold standard for pH accuracy (±0.01–0.02 pH in lab conditions). Decades of refinement, well-understood behavior, wide operating range (0–14 pH). Weaknesses: fragile glass bulb, reference junction clogging, electrolyte depletion, temperature sensitivity requiring ATC.
Optical ISFET / Photometric pH: ISFET uses semiconductor technology instead of glass — rugged, fast response, non-glass. Photometric pH uses indicator dyes and absorbance ratio. Both currently achieve ±0.05–0.1 pH, sufficient for most process control but not analytical lab work.
Verdict: Glass electrode for precision labs. ISFET optical probe for rugged field deployment, food processing, and general industrial use.
Electrode (2-Electrode / 4-Electrode): Mature, reliable, cost-effective. Four-electrode design is highly recommended for fouling-prone waters (wastewater, high-solids) as it compensates for coating buildup on electrodes. Wide range: 0.01 μS/cm to 500 mS/cm with cell constant selection.
Inductive (Non-Contact): Non-contact inductive technology exists for ultra-pure water and aggressive chemicals, but it's expensive ($3,000+) and unsuitable for low-conductivity applications (<20 μS/cm).
Verdict: 4-electrode conductivity is the workhorse for 95% of applications. Inductive only for ultrapure water or corrosive processes.
UV Absorption (SAC254): Measures Spectral Absorption Coefficient at 254 nm as a real-time proxy for COD/BOD. No reagents, continuous output, response time <10 seconds. Correlates well to dichromate COD (R² = 0.85–0.95) after site-specific calibration. Excellent for trend monitoring and process control triggers. The US EPA Method 415.3 recognizes UV-based organic carbon measurement as an approved alternative method.
Lab Reference Method: Traditional COD requires hazardous chemicals (potassium dichromate, sulfuric acid mercury), 2-hour digestion, and skilled technicians. Not suitable for online monitoring.
Verdict: UV optical water sensor technology is transformative for real-time organic load monitoring — replacing 2-hour lab tests with continuous data.
UV Absorption Sensor: Nitrate has strong UV absorbance at 220 nm and 270 nm. Dual-wavelength measurement corrects for organic interference. Effective range: 0.1–100 mg/L NO₃-N. Works well in drinking water, groundwater, and treated wastewater effluent. The WHO Guidelines for Drinking-water Quality set the nitrate standard at 50 mg/L (as NO₃), which this optical water sensor technology reliably monitors online.
Ion-Selective Electrode (ISE): Lower cost, but suffers from chloride interference, limited lifespan, and sensitivity to sample matrix changes.
Verdict: UV optical measurement is the professional choice for continuous nitrate monitoring in drinking water and groundwater networks.
Pros & Cons: Summary
✅ Optical Advantages
- Near-zero routine maintenance (calibrate annually or less)
- No consumables — no membranes, electrolytes, or filling solutions
- Fouling-resistant — smooth surface without membrane pores
- Flow-rate independent measurements
- Fast response times (under 30 seconds for DO)
- No sample consumption (non-destructive principle)
- Digital output ready for SCADA/IIoT integration
- Wider temperature and pressure operating ranges
❌ Optical Limitations
- Higher initial purchase price (2–3× electrode cost)
- Sensor cap/luminophore replacement needed every 1–2 years
- Cannot measure all parameters (ORP, some ion-selective)
- Some UV sensors affected by bubble passage or intense color
- pH accuracy (ISFET) still trails glass electrodes
- Technology lock-in — caps usually vendor-specific
✅ Electrode Sensor Advantages
- Lower upfront cost — accessible entry point
- Highest available accuracy for lab pH (±0.001 pH achievable)
- Wide availability, interchangeable brands/suppliers
- Well-understood failure modes and repair procedures
- Proven track record — decades of field data
- Measures some parameters optics cannot (ORP, ammonium ISE)
❌ Electrode Sensor Limitations
- High ongoing maintenance burden (weekly-monthly)
- Consumables create supply chain dependency
- Membrane fouling is #1 cause of data quality issues
- Flow-rate dependent readings require pumping/stirring
- Slower response (especially thick-membrane probes)
- Consumes sample (galvanic DO reduces local O₂)
- Glass breakage risk (pH electrodes)
4. Application Recommendations by Industry
The same sensor technology performs very differently depending on where it's deployed — aquaculture ponds, wastewater aeration basins, drinking water networks, and industrial process streams each present unique challenges. Here's our field-tested guidance for the most common monitoring scenarios:
| Application | Recommended Primary | Recommended Secondary | Rationale |
|---|---|---|---|
| Aquaculture (Fish/Shrimp Farming) | Optical: DO + Turbidity | Digital pH + EC Electrode | Remote locations = maintenance cost is king. Biofouling is extreme in high-nutrient pond environments. Fish kill prevention demands fast DO response — only optical luminescence delivers <30s t₉₀ with stir-independent operation. The FAO recommends continuous dissolved oxygen monitoring for intensive aquaculture operations. |
| Wastewater Treatment Plant | Optical: DO + UV-COD + Nitrate | Digital pH/ORP/EC (4-electrode) | Aeration basin control needs real-time DO without membrane clogging. According to the US EPA NPDES program, continuous optical monitoring significantly improves discharge compliance. UV sensors replace 2-hr lab COD tests for real-time process optimization and energy savings on blowers. |
| Drinking Water Distribution | Optical: Turbidity + Free Chlorine | pH Glass Electrode + EC | Turbidity is the critical safety parameter for filter breakthrough detection. Optical nephelometry delivering 0.001 NTU resolution meets the regulatory standard under WHO Drinking-water Quality Guidelines. No electrode technology can match optical instruments for real-time turbidity monitoring in distribution networks. |
| Industrial Process Water | Parameter-dependent hybrid approach | Optical where maintenance is a concern | Cooling towers: EC + pH. Plating baths: ORP + metal-specific ISE. Food & beverage: ISFET optical preferred (hygiene/no glass breakage). |
| Surface Water / Environmental | Optical: DO + Turbidity + Chlorophyll | pH + EC + Optional Nutrient Probes | Long unattended deployments in rivers, lakes, and coastal waters favor minimal-maintenance instrumentation. Multiparameter sondes rely on optical technology for core parameters as highlighted by the USGS Water Quality Monitoring program, which validates optical sensor accuracy through ongoing field intercomparison studies. |
| Groundwater Monitoring | Optical: DO + UV Nitrate | pH + EC + Water Level | Low-fouling environment extends both technologies' life. Optical wins on calibration interval for deep wells — 12-month intervals vs monthly. |
| Laboratory / QA-QC | High-Precision Glass pH + Lab DO Electrode | Conductivity Cell (temperature-controlled) | Absolute accuracy trumps convenience here. Benchtop conditions allow frequent maintenance. Cost is secondary. |
5. Total Cost of Ownership: Optical vs Electrode
The purchase price tells only a fraction of the story. Let's model a realistic 5-year deployment comparing an optical DO probe against a galvanic electrode for a dissolved oxygen monitoring station:
Assumptions: Single DO monitoring point, moderate fouling environment (aquaculture pond or WWTP aeration basin), labor rate $50/hr, 30-minute site visit for calibration/maintenance, quarterly verification visits required for electrodes.
| Cost Category | Optical DO Probe | Galvanic Electrode DO |
|---|---|---|
| Initial Sensor Purchase | $1,200 (mid-range luminescence probe) | $450 (galvanic DO probe with cable) |
| Cable / Transmitter | $180 (digital interface) | $180 (analog/digital transmitter) |
| Consumables (5-year) | $150 (one luminophore cap @ Year 2.5) | $1,200 (40 membrane kits × $30) |
| Calibration Labor | $250 (5 calibrations × 0.5hr × $50/hr) | $4,000 (80 calibrations × 1hr × $50/hr — includes travel time allocation) |
| Replacement Probes (5-yr) | $0 (optical probe body lasts 5+ years) | $700 (2 full probe replacements @ $350) |
| Data Gap Risk Cost | $0 (negligible drift, predictable performance) | $300–$1,000 (data gaps from membrane failures) |
| 5-YEAR TOTAL | $1,780 – $2,280 | $6,830 – $8,830 |
| Optical technology saves $5,000–$6,500 over 5 years (65–75% lower TCO) | ||
The math is clear: the higher upfront investment in optical technology recovers itself within 12–18 months, then continues generating savings throughout the remaining deployment life. For multi-point installations (10, 20, or 50+ sensors), the savings scale proportionally — potentially reaching six figures over a 5-year program. A fleet of 20 optical DO probes typically saves $100,000–$130,000 in operating costs compared to an equivalent electrode fleet.
One caveat: If your application is low-duty-cycle spot-checking (grabbing a DO reading once per week with a handheld meter), the TCO calculation shifts. A handheld electrode meter at $300 that gets calibrated monthly may never reach the crossover point against a handheld optical probe at $900. Know your usage pattern — continuous monitoring favors optical technology, while occasional spot-checking may not justify the upfront premium.
6. Decision Framework: When to Choose Optical Technology
Use this systematic approach to make the right call for your specific situation. A disciplined evaluation will tell you whether optical instruments are worth the premium:
Quick-Selection Rules of Thumb
✓ Deploying sensors in hard-to-access or remote locations
✓ High biological fouling expected (wastewater, aquaculture)
✓ Continuous/unattended monitoring (>3 days between visits)
✓ Measuring DO, turbidity, COD, nitrate, or chlorophyll
✓ Fast response critical (process control, alarm triggers)
✓ Labor cost exceeds $35/hr or technician travel time is significant
✓ Deployment horizon is 3+ years
✓ Ultra-high-precision laboratory measurements required
✓ Measuring ORP, ammonium (NH₄⁺ ISE), fluoride, or other ion-selective params
✓ Ultra-low conductivity (<1 μS/cm) — ultrapure water
✓ Budget strictly limited and deployment is short-term (<1 year)
✓ Frequent physical access for maintenance is guaranteed
✓ Application is low-frequency spot-checking, not continuous monitoring
7. The Future of Optical Water Sensor Technology
The trajectory is unmistakable: optical water sensor and solid-state technologies are steadily displacing traditional electrochemical sensors across an expanding range of parameters. Every year, another parameter once exclusive to electrodes becomes measurable by light-based instruments. Here are the trends shaping the next 5 years:
Miniaturization & Integration: MEMS-scale optical components are shrinking multiparameter sonde footprints dramatically. What required a 3-inch diameter probe housing 5 years ago now fits in a 1-inch package — opening new form factors for pipe-insertion probes, in-line process sensors, and wearable environmental monitors.
AI-Enhanced Diagnostics: Modern smart optical instruments don't just output numbers — they monitor their own health. Machine learning algorithms detect early signs of fouling, predict remaining luminophore cap life, flag anomalous readings that suggest calibration drift, and automatically compensate for interference. Self-diagnosing capabilities dramatically reduce silent data quality failures in unattended monitoring networks.
Self-Cleaning Mechanisms: Air-burst cleaning, ultrasonic wipers, and mechanical brush systems are becoming standard options for probes deployed in high-fouling environments. Combined with inherently lower maintenance requirements, unattended deployment windows now push toward 6 months or longer — transforming how environmental agencies and industrial operators budget for field service.
New Optical Parameters: Research-stage designs are approaching commercial viability for phosphate (molybdenum blue absorbance), ammonia (indophenol method), and even heavy metals (complexation + absorbance). Within 5 years, fully optical multiparameter sondes could cover 90% of standard water quality monitoring needs — making optical technology the default choice for nearly every routine parameter.
What Won't Change Soon: Glass pH electrodes will remain the laboratory accuracy benchmark for the foreseeable future. Ion-selective electrodes for niche analytes persist where no optical alternative exists. However, for the 80% of water quality parameters that matter most in field monitoring — DO, turbidity, COD, nitrate, chlorophyll, and increasingly ammonia and phosphate — the optical water sensor is the present, not just the future. Ongoing validation by the USGS National Field Manual continues to build regulatory confidence in optical measurement data quality.
Frequently Asked Questions About Optical Water Sensors
An optical water sensor uses light-based measurement principles (absorbance, fluorescence, scattering) with no consumable membranes or electrolytes. Electrode sensors rely on electrochemical reactions across a membrane or sensing surface, requiring regular calibration, membrane replacement, and electrolyte refilling. The fundamental difference is maintenance burden: an optical water sensor is virtually maintenance-free for 1–2 years, while electrodes need attention every 2–8 weeks depending on the parameter being measured.
It depends on the application. For dissolved oxygen in wastewater and aquaculture (0–20 mg/L range), a modern optical DO instrument matches or exceeds electrode accuracy (<±1% of reading) while eliminating drift from membrane fouling. For pH measurement, traditional glass electrodes still offer slightly better absolute accuracy (±0.01 pH vs ±0.05 pH for ISFET alternatives). For turbidity and suspended solids, optical nephelometry is the only viable option — electrodes cannot measure these parameters at all.
Optical DO instruments typically require calibration once every 6–12 months, and many models ship pre-calibrated with factory-stable readings for up to 2 years. Electrode sensors demand calibration every 1–4 weeks for reliable data. In field deployments, this difference translates to roughly 10–50× fewer site visits per year — a critical factor when sensors are installed in remote locations like aquaculture ponds, offshore platforms, or mountain stream stations.
For aquaculture, optical DO monitoring is overwhelmingly preferred because: (1) it handles biofouling far better than membranes, (2) flow-rate independence eliminates the need for stirring mechanisms, (3) rapid response time (<30s) catches sudden DO drops that cause fish kills, and (4) low maintenance reduces labor costs dramatically in remote fish farm operations. The higher upfront cost typically pays back within 6–12 months through reduced travel and replacement part expenses alone.
A typical scenario comparing an optical DO probe ($800–1,500) against a galvanic electrode ($300–600): Over 5 years, the electrode requires ~40 membrane/electrolyte kits (~$1,200), ~60 calibrations (~$4,000 labor), and likely 2 full probe replacements (~$700). Total electrode TCO: approximately $6,200–7,000. The optical probe needs no consumables, ~5 calibrations (~$400 labor), and possibly one cap replacement ($150). Total optical TCO: approximately $2,000–2,500. Despite the 2–3× higher initial price, optical technology delivers 60–70% lower TCO over the deployment lifetime.
Not yet. An optical water sensor excels at dissolved oxygen, turbidity, COD/BOD (UV absorption), nitrate (UV absorption), and emerging pH/ISFET applications. However, traditional electrodes remain superior for: high-precision laboratory pH (glass electrodes offer ±0.001 pH), ORP/redox measurements, conductivity below 1 μS/cm, and certain ion-selective measurements (ammonium, fluoride). The industry trend is hybrid deployment — optical water sensor for high-maintenance parameters (DO, turbidity, COD) and robust digital electrodes for stable parameters (pH, EC, ORP).
Ready to Deploy Optical Monitoring?
Whether you're building a new monitoring station or replacing aging electrode sensors that demand constant maintenance, our engineering team can help you select the right optical water sensor configuration — matched to your specific water matrix, accuracy requirements, and budget constraints.
Get a Custom Sensor Recommendation →
