Aquaculture Water Quality Monitoring: RAS, Ponds & Shrimp
October 29, 2026
POME Monitoring: Sensor Selection for Palm Oil Mill Effluent Treatment
Palm oil mill effluent (POME) is one of the most demanding wastewaters in any industry: extremely high organic load, heavy grease, acidic pH, and seasonal hydraulic swings tied to the harvest calendar. Monitoring it well is not just compliance — the anaerobic treatment train that POME requires is also a biogas asset, and the same parameters that keep the discharge legal keep the digester profitable. This page maps the POME monitoring points, sensor choices and failure modes across a typical treatment train.
What makes POME difficult
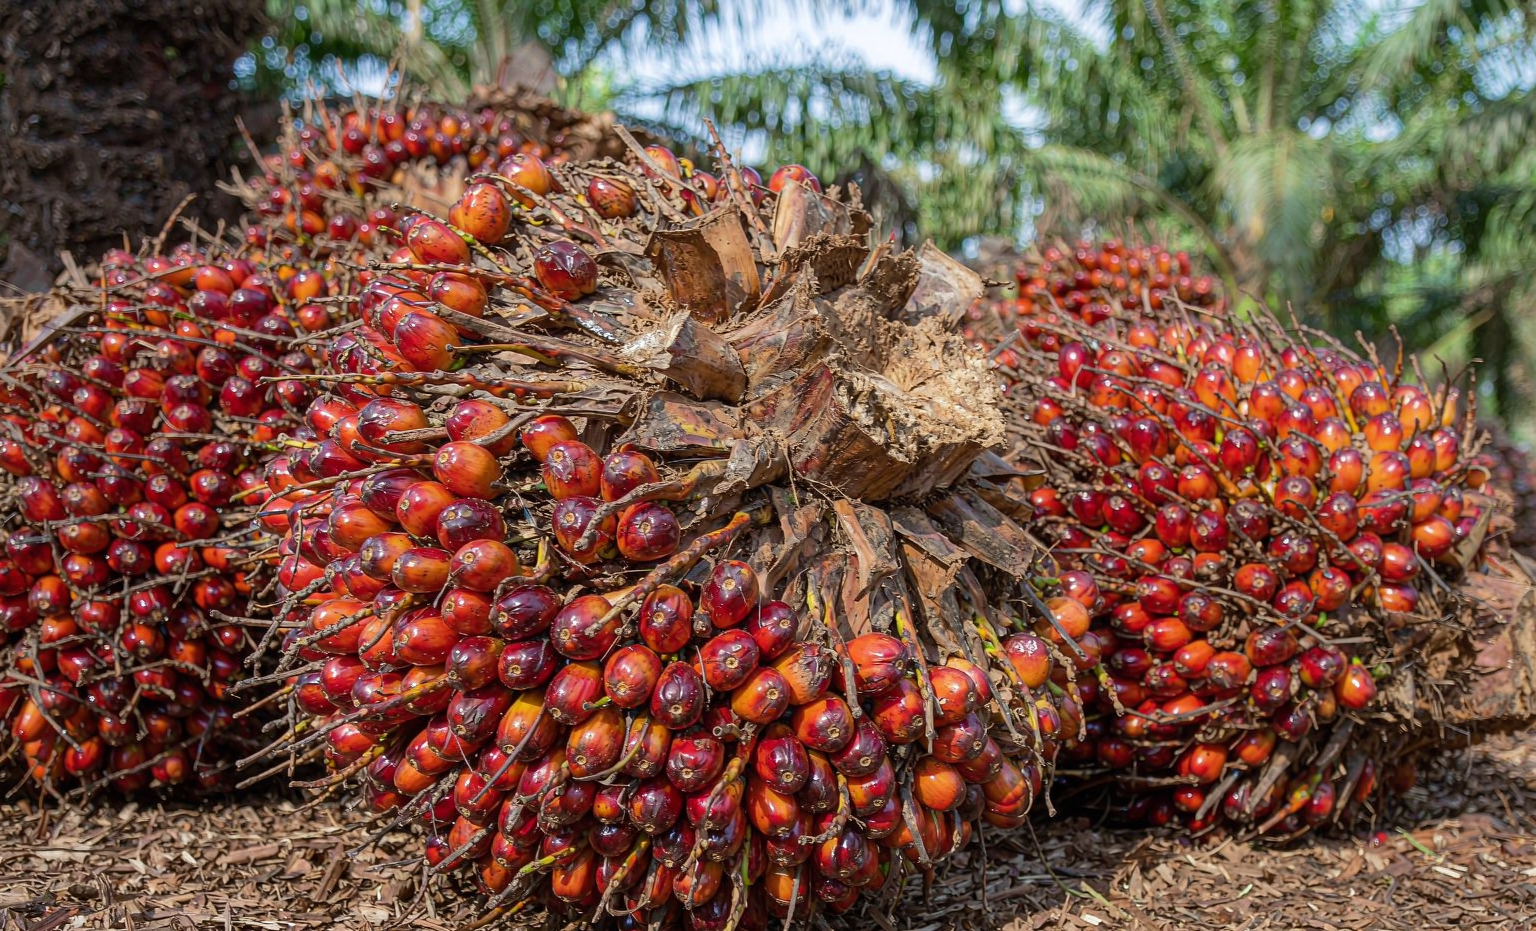
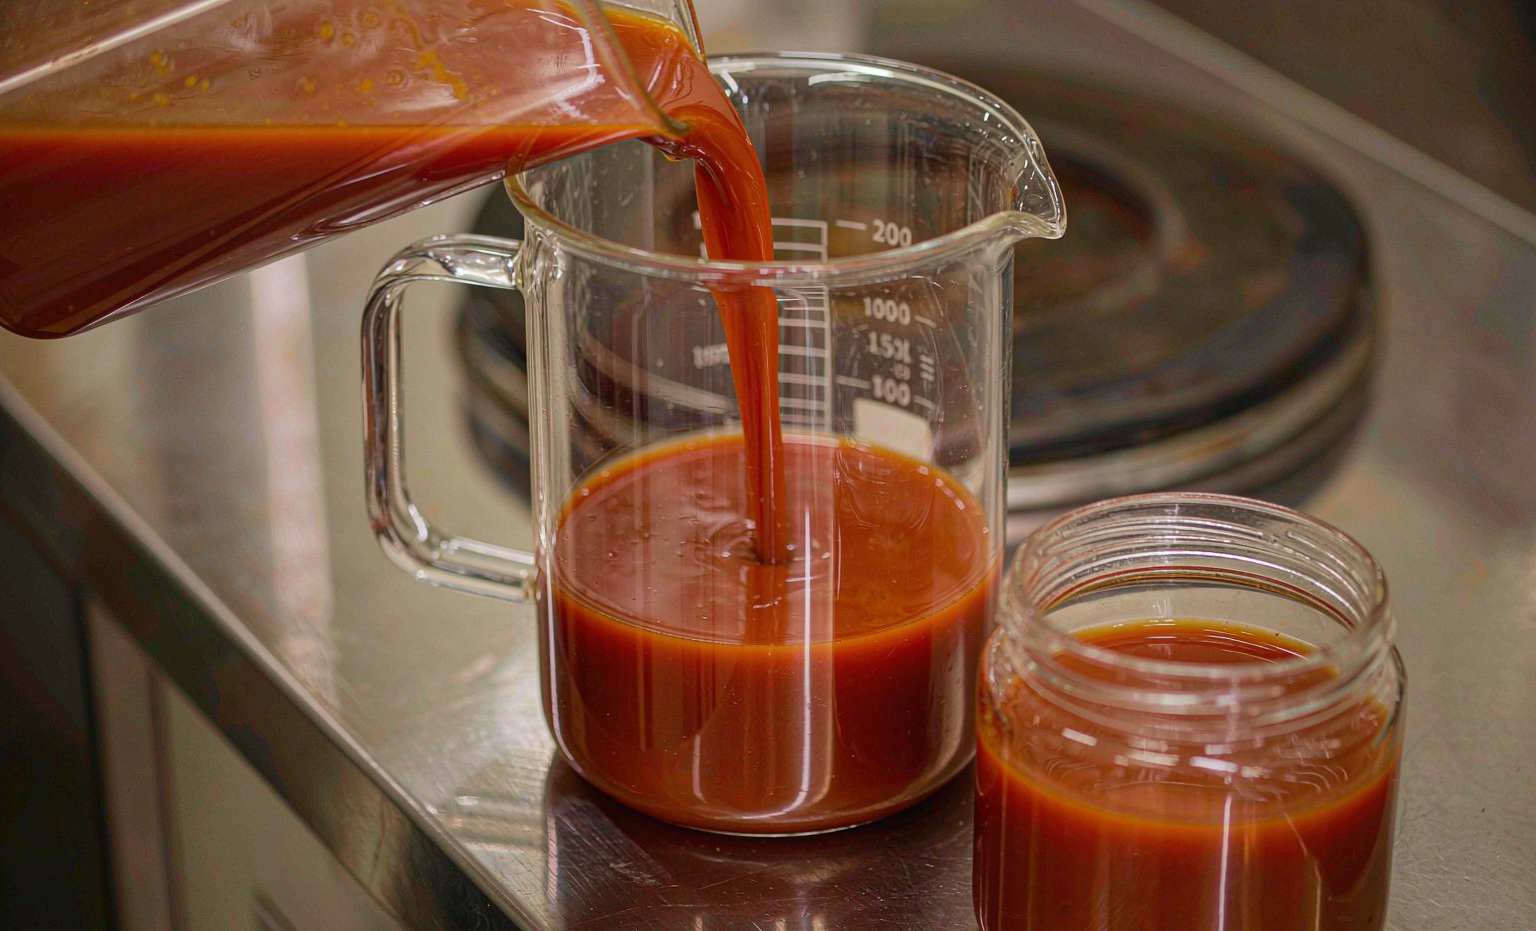
Raw POME is a thick, acidic, oily, high-solids slurry. Published characterization studies place its typical COD in the range of roughly 40,000–100,000 mg/L, BOD roughly 20,000–50,000 mg/L, oil and grease in the thousands of mg/L, and pH around 4–5. Exact values vary by mill, process and season — treat these as order-of-magnitude figures and sample your own stream. Three properties dominate sensor selection:
- Grease and fibre. Coats optical surfaces and electrodes faster than almost any other effluent. Anything without automatic cleaning is a maintenance liability.
- High, variable organic load. Dilution varies with processing volume, so concentrations swing widely — trends matter more than absolute points.
- Sulfides. Anaerobic zones produce H₂S, which corrodes copper-bearing electronics and poisons some electrochemical sensors.
POME monitoring points across the treatment train
Most mills treat POME in a ponding system — anaerobic, facultative and aerobic (or polishing) ponds in series — while newer and larger installations use closed anaerobic digesters with biogas capture. The monitoring points differ:
| Treatment stage | What to monitor and why | Recommended instrumentation |
|---|---|---|
| Influent / sump | Flow and pH to understand load arriving from the mill; protects downstream biology | Flow meter + ruggedized pH electrode with cleaning; sample-based COD for characterisation |
| Anaerobic ponds / digester | pH and ORP (acidification vs methanogenesis balance); temperature; biogas flow where captured | pH + ORP probes with automatic cleaning; digester temperature; gas flow meter |
| Facultative ponds | pH and ORP trends; algae-driven oxygen dynamics | Low-maintenance pH; ORP; periodic lab COD/BOD |
| Aerobic / polishing ponds | Dissolved oxygen (aeration control), TSS/turbidity | Optical DO with wiper; turbidity sensor for solids carryover |
| Final discharge | Compliance: BOD/COD, TSS, pH, ammonia-nitrogen, oil & grease (methods per local regulation) | Online pH + turbidity/TOC surrogates correlated to lab; compliance sampling per permit |
Surrogate parameters: the practical online strategy
True online COD and BOD analyzers for raw POME are expensive and reagent-hungry at these concentrations. The pragmatic architecture for POME monitoring is surrogate monitoring: continuously measure what responds instantly — UV254 absorbance, turbidity, pH, temperature, DO — and correlate each against weekly or biweekly laboratory COD/BOD on your own stream. Once a correlation is validated and periodically re-checked, the online trend becomes a real-time stand-in for the lab parameter. Our COD vs BOD vs TOC guide explains which surrogate answers which question, and the COD monitoring guide covers correlation building in detail.
Sensor selection matrix for POME conditions
| Parameter | Technology choice | Why it survives POME |
|---|---|---|
| Dissolved oxygen | Optical DO, wiper-cleaned, stainless housing | No membrane to grease-coat off; the wiper clears biofilm and oil film; flow independence suits pond duty |
| pH | Industrial gel electrode with automatic air-jet or wiper cleaning | Acidic, oily water destroys unprotected electrodes quickly; cleaning is not optional |
| ORP | Platinum band, automatic cleaning | Robust trend instrument for anaerobic/aerobic transition monitoring |
| Turbidity / TSS | Infrared 90° nephelometric sensor, wiper | ISO 7027-style IR optics tolerate the color of partially treated POME better than white light |
| Organic load trend | UV254 absorbance probe (after solids screening) | Fast, reagent-free surrogate for soluble COD fraction; needs site correlation |
| Ammonia-nitrogen | ISE ammonium sensor at polishing stage | Concentrations are manageable after the ponds; ISE cartridges are serviceable |
| Level / flow | Radar or ultrasonic level; open-channel flow | Hydraulic variation drives the whole system — load = flow × concentration |
Deployment notes
- Screen before you measure. Remove fibres and coarse solids ahead of any optical sensor; a simple grit screen extends sensor life dramatically.
- Clean automatically, verify manually. Set wiper/air-jet intervals by season; during peak harvest, fouling accelerates.
- Protect electronics from H₂S. Prefer sealed housings and non-corroding connectors near anaerobic zones; ventilate enclosures.
- Mount for access. Pond sensors on walkway-reachable davits or buoys — a sensor nobody wants to walk to is a sensor that stops being calibrated.
- Log load, not just concentration. Pair flow with pH/UV254 so operators see kilogram-load swings when processing volume changes.
Common failure patterns
| Symptom | Likely cause | Prevention |
|---|---|---|
| DO reading falls steadily over days | Oil film and biofilm on the optical cap | Wiper on a short interval; manual wipe + handheld cross-check weekly |
| pH drifts and will not calibrate | Grease-coated junction / electrode aged by acid | Automatic cleaning; keep 2–3 spare electrodes; never let probes dry |
| UV254 correlation collapses | Stream composition changed (new crop batch, POME dilution) | Re-validate the correlation monthly; flag ratio shifts as process events |
| Sensor cables corrode at glands | H₂S-rich atmosphere near anaerobic ponds | Sealed glands, corrosion-resistant connectors, elevated junction boxes |
| Data looks too good during harvest peak | Sensor fouled into constant reading; logger healthy, sensor blind | Trend alarms on flat-line signal — a perfectly constant reading in POME is a fault |
From monitoring to RFQ
When requesting a proposal, specify: treatment train layout (ponds, digester, or both), approximate daily throughput, whether biogas is captured, discharge limits in your jurisdiction, power availability at monitoring points, and who will maintain the instruments. Clear answers here are what make POME monitoring survivable in year two. For a like-for-like comparison, ask each vendor for the maintenance schedule and consumable list alongside the price — our five-year TCO guide and global brand vs direct manufacturer comparison give you the framework. Multi-parameter options such as the Basic All-in-One sensor cover DO, pH-equivalent channels and organics trends in one deployment.
Mapping POME monitoring sensors onto your treatment train?
Send us your train layout, throughput and discharge limits. We will return a monitoring-point map with sensor models, cleaning schedules and a correlation plan for the surrogate parameters.